使用EPPlus实现C#控件Excel文件内容导入转换
1.添加EPPlus库
在使用EPPlus库时,你需要确保在项目中添加了正确的引用。你可以通过以下方式添加引用:
-
打开你的项目。
-
在“解决方案资源管理器”中,右键单击“引用”并选择“管理NuGet程序包”。
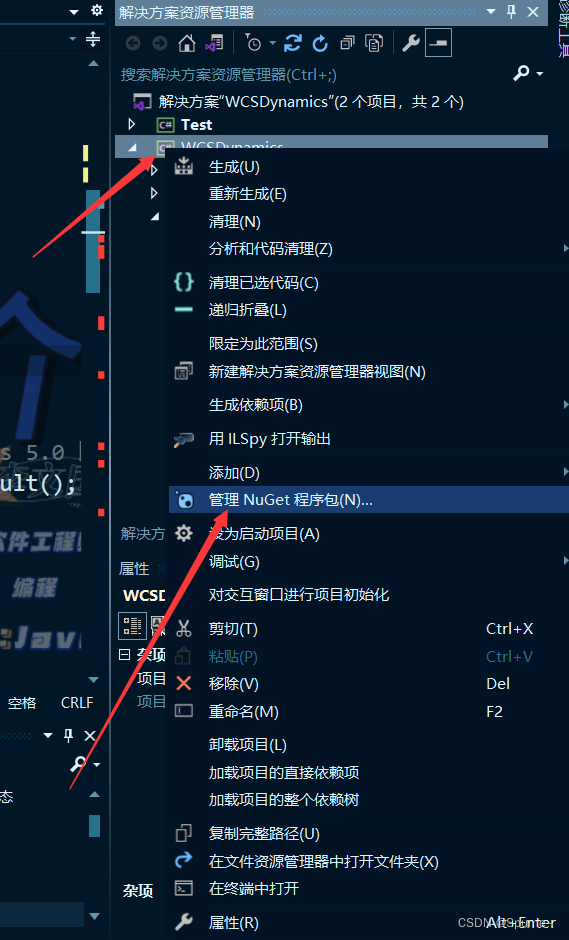
-
在NuGet包管理器中,搜索“EPPlus”。
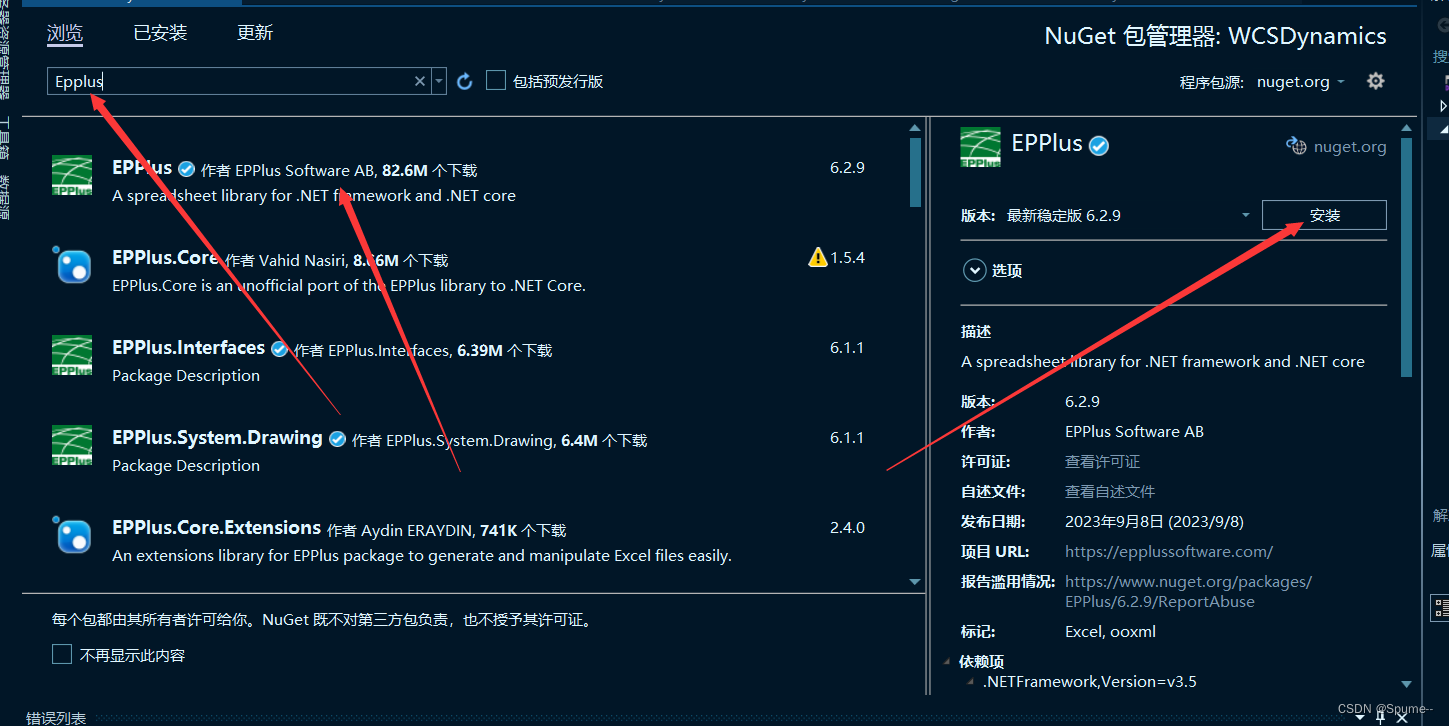
-
安装EPPlus库。
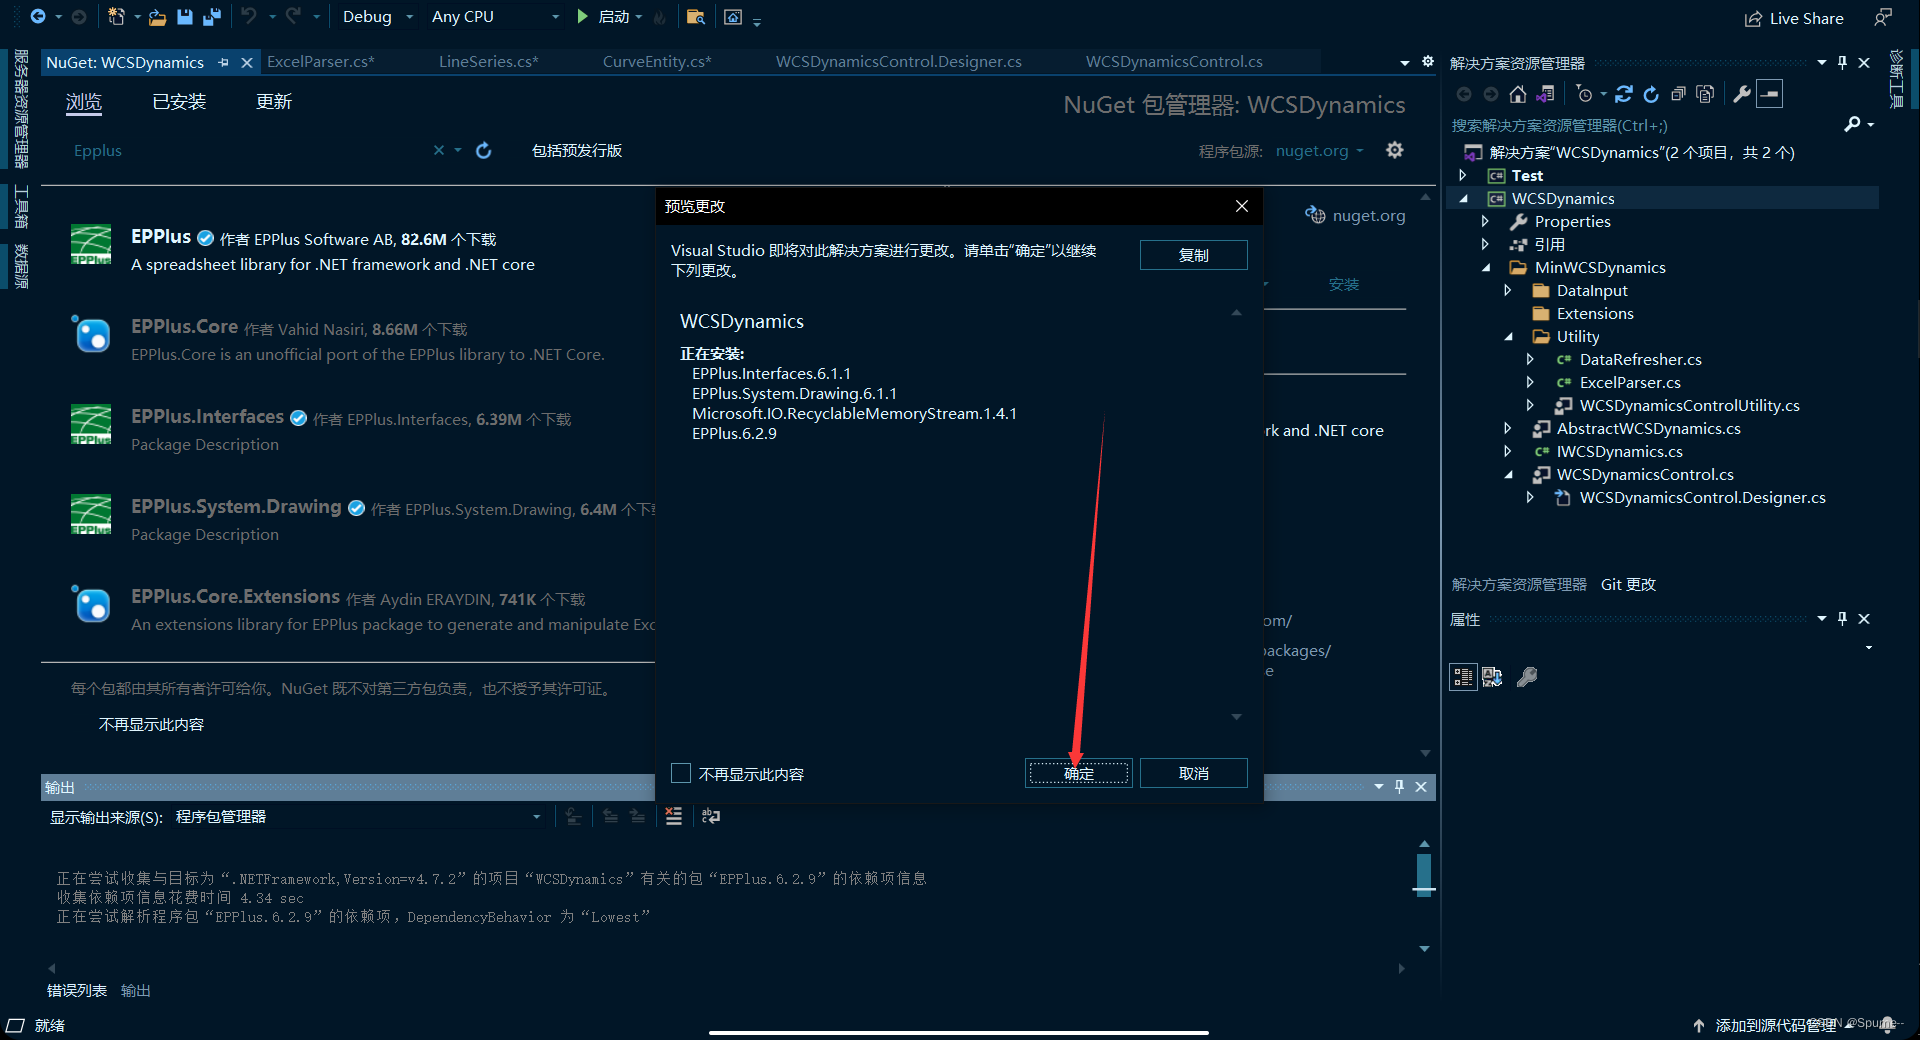
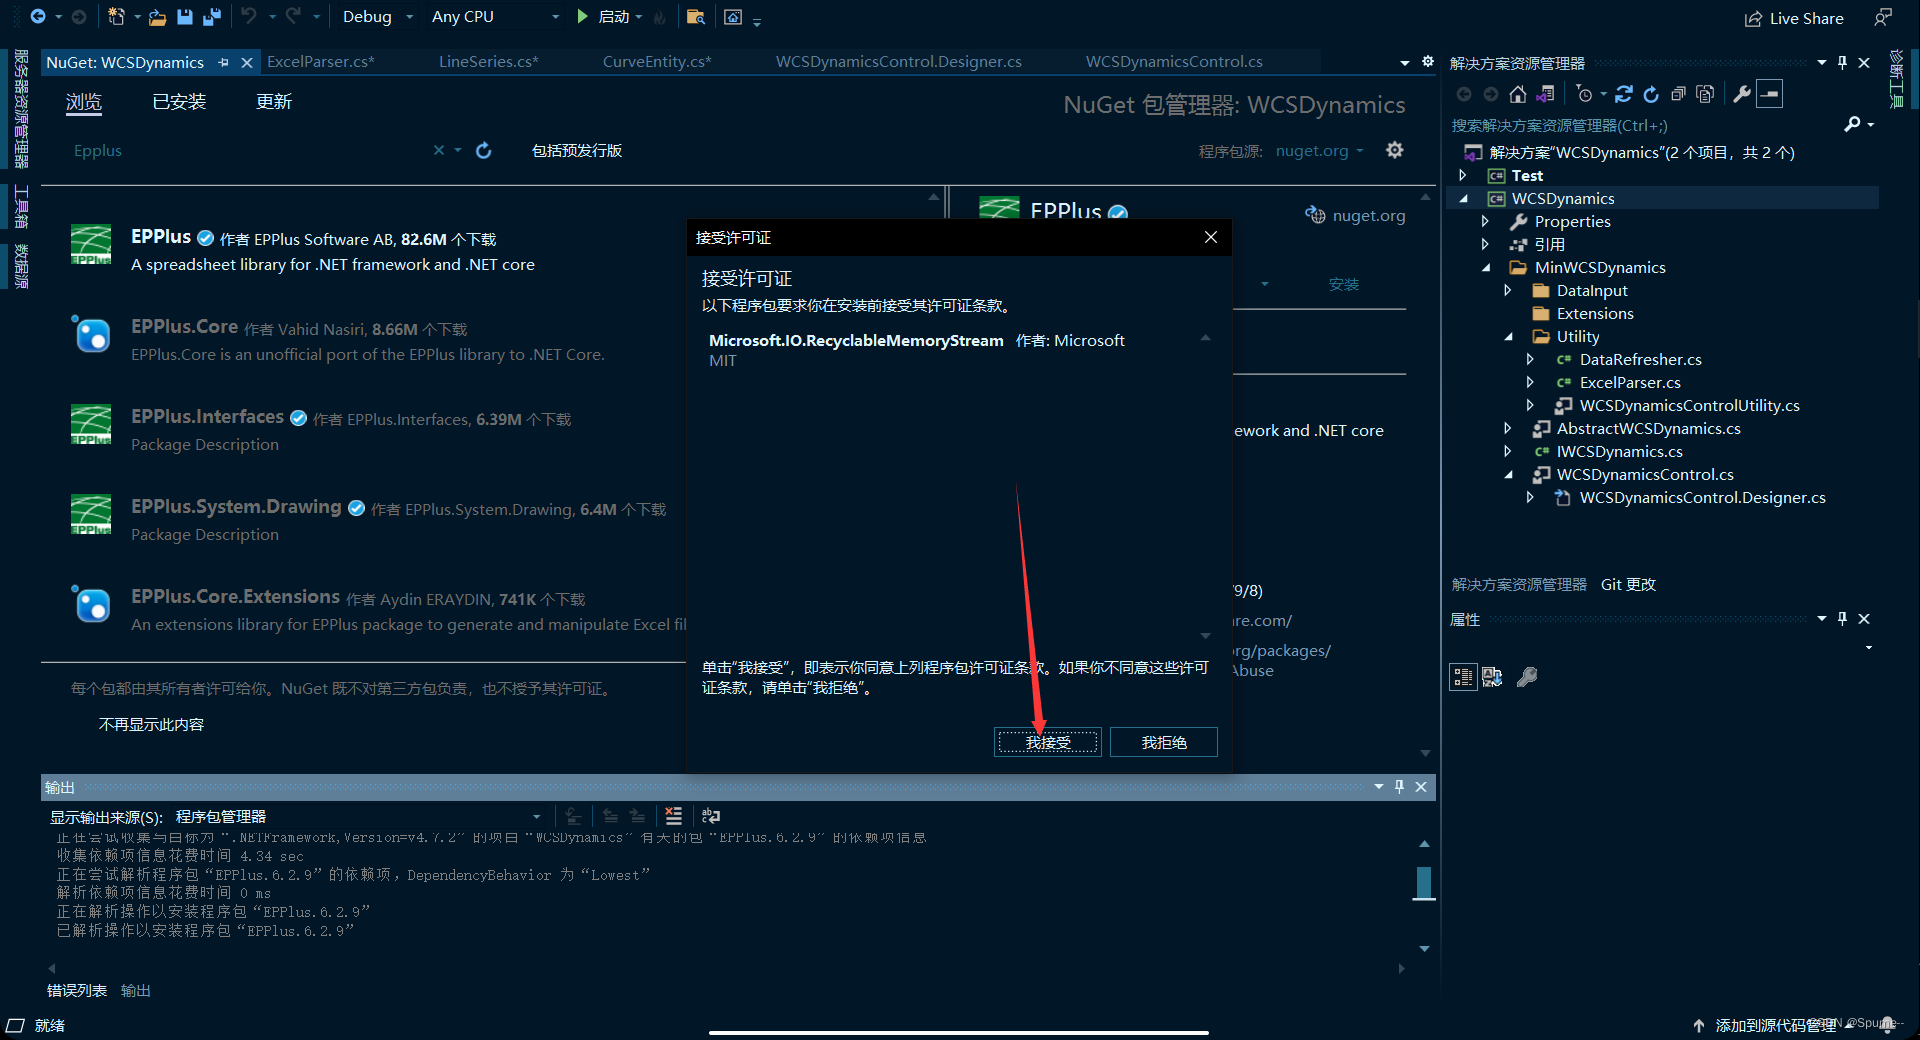
一旦你完成了这些步骤,你的项目就会包含所需的EPPlus引用,并且你应该能够在代码中使用using OfficeOpenXml;而不会遇到错误。
如果你仍然遇到问题,请确保你的开发环境中已经安装了EPPlus库,并且你的项目引用了正确的库版本。
2.示例操作
要实现将Excel表格中的数据解析为CurveEntity实体类,并将解析后的数据存储到curveEntities列表中,然后传递给控件,可以使用C#和一些库来处理Excel文件。
在这个示例中,我将使用EPPlus库来读取Excel文件。首先,确保你已经将EPPlus库添加到你的项目中。
接下来,创建一个方法来解析Excel表格并将数据存储到curveEntities列表中。下面是一个示例代码:
// *****************************************************************************
// File: ExcelParser.cs
// Author: 李文国
// Email: LJHX5470@qq.com
// Date: 2023-09-25
// Project Name: WCSDynamics
// Version: 1.2.3
// Company: EVADA
// Mentor: 叶信文
// Copyright (C) 2023 EVADA. All rights reserved.
// *****************************************************************************

using OfficeOpenXml;
using System;
using System.Collections.Generic;
using System.Drawing;
using System.IO;
using System.Linq;
using WCSDynamics.MinWCSDynamics.DataInput;

namespace WCSDynamics.MinWCSDynamics.Utility
{
    public class ExcelParser
    {
        private List<CurveEntity> curveEntities = new List<CurveEntity>();

        public List<CurveEntity> ParseExcel(string filePath)
        {
            FileInfo fileInfo = new FileInfo(filePath);

            using (ExcelPackage package = new ExcelPackage(fileInfo))
            {
                ExcelPackage.LicenseContext = LicenseContext.NonCommercial;//EPPlus 5.0 以后的版本需要指定 商业证书 或者非商业证书。你需要在代码里指定证书或者降低EPPlus版本。在代码里面指定非商业证书
                ExcelWorksheet worksheet = package.Workbook.Worksheets.FirstOrDefault();

                if (worksheet == null)
                {
                    throw new Exception("Excel文件为空或不包含任何工作表。");
                }

                int rowCount = worksheet.Dimension.Rows;

                for (int row = 2; row <= rowCount; row++)
                {
                    string name = worksheet.Cells[row, 1].Text; // 读取曲线名称
                    Color lineColor = ColorTranslator.FromHtml(worksheet.Cells[row, 2].Text); // 读取曲线颜色
                    List<PointF> dataSource = ParsePointData(worksheet.Cells[row, 3].Text); // 读取数据点
                    bool isVisible = bool.Parse(worksheet.Cells[row, 4].Text); // 读取是否可见
                    int pointCount = dataSource.Count; // 计算数据点个数
                    string description = worksheet.Cells[row, 5].Text; // 读取曲线介绍

                    CurveEntity curveEntity = new CurveEntity
                    {
                        Name = name,
                        LineColor = lineColor,
                        _dataSource = dataSource,
                        IsVisible = isVisible,
                        PointCount = pointCount,
                        Description = description
                    };

                    curveEntities.Add(curveEntity);
                }
            }

            return curveEntities;
        }

        private List<PointF> ParsePointData(string pointData)
        {
            // 解析逗号分隔的坐标数据,例如:"1.0,2.0;3.0,4.0;5.0,6.0"
            List<PointF> points = new List<PointF>();
            string[] pointPairs = pointData.Split(';');
            foreach (string pair in pointPairs)
            {
                string[] coordinates = pair.Split(',');
                if (coordinates.Length == 2)
                {
                    float x = float.Parse(coordinates[0]);
                    float y = float.Parse(coordinates[1]);
                    points.Add(new PointF(x, y));
                }
            }
            return points;
        }
    }

}
以上代码切记不可缺少:
ExcelPackage.LicenseContext = LicenseContext.NonCommercial;//EPPlus 5.0 以后的版本需要指定 商业证书 或者非商业证书。你需要在代码里指定证书或者降低EPPlus版本。在代码里面指定非商业证书
要实现将Excel表格中的数据解析为CurveEntity实体类,并将解析后的数据存储到curveEntities列表中,然后传递给控件,你可以使用C#和一些库来处理Excel文件。在这个示例中,我将使用EPPlus库来读取Excel文件。首先,确保你已经将EPPlus库添加到你的项目中。
接下来,创建一个方法来解析Excel表格并将数据存储到curveEntities列表中。下面是一个示例代码:
csharpCopy codeusing OfficeOpenXml;
using System;
using System.Collections.Generic;
using System.Drawing;
using System.IO;
using System.Linq;

public class ExcelParser
{
    private List<CurveEntity> curveEntities = new List<CurveEntity>();

    public List<CurveEntity> ParseExcel(string filePath)
    {
        FileInfo fileInfo = new FileInfo(filePath);

        using (ExcelPackage package = new ExcelPackage(fileInfo))
        {
            ExcelWorksheet worksheet = package.Workbook.Worksheets.FirstOrDefault();

            if (worksheet == null)
            {
                throw new Exception("Excel file is empty or does not contain any worksheets.");
            }

            int rowCount = worksheet.Dimension.Rows;

            for (int row = 2; row <= rowCount; row++)
            {
                string name = worksheet.Cells[row, 1].Text;
                Color lineColor = ColorTranslator.FromHtml(worksheet.Cells[row, 2].Text);
                List<PointF> dataSource = ParsePointData(worksheet.Cells[row, 3].Text);
                bool isVisible = bool.Parse(worksheet.Cells[row, 4].Text);
                int pointCount = dataSource.Count;
                string description = worksheet.Cells[row, 5].Text;

                CurveEntity curveEntity = new CurveEntity
                {
                    Name = name,
                    LineColor = lineColor,
                    _dataSource = dataSource,
                    IsVisible = isVisible,
                    PointCount = pointCount,
                    Description = description
                };

                curveEntities.Add(curveEntity);
            }
        }

        return curveEntities;
    }

    private List<PointF> ParsePointData(string pointData)
    {
        // 解析逗号分隔的坐标数据,例如:"1.0,2.0;3.0,4.0;5.0,6.0"
        List<PointF> points = new List<PointF>();
        string[] pointPairs = pointData.Split(';');
        foreach (string pair in pointPairs)
        {
            string[] coordinates = pair.Split(',');
            if (coordinates.Length == 2)
            {
                float x = float.Parse(coordinates[0]);
                float y = float.Parse(coordinates[1]);
                points.Add(new PointF(x, y));
            }
        }
        return points;
    }
}
然后,在你的应用程序中,你可以使用上述类来解析Excel文件,并将解析后的数据传递给控件。示例代码如下:
public class YourApplicationClass
{
    private List<CurveEntity> curveEntities;

    public void LoadExcelData(string filePath)
    {
        ExcelParser excelParser = new ExcelParser();
        curveEntities = excelParser.ParseExcel(filePath);

        // 将解析后的数据传递给控件
        wcsDynamicsControl1.curveEntities = curveEntities;
    }
}
确保将LoadExcelData方法调用与Excel文件的实际路径一起使用,以加载和解析数据并传递给控件。
以下是使用之前设计的ExcelParser类来解析Excel表格数据并传递给控件的示例控件测试代码:
using System;
using System.Collections.Generic;
using System.Drawing;
using System.Windows.Forms;

namespace Test
{
    public partial class Form1 : Form
    {
        private List<CurveEntity> curveEntities = new List<CurveEntity>();

        public Form1()
        {
            InitializeComponent();

            // 解析Excel数据并将其存储到curveEntities集合中
            ExcelParser excelParser = new ExcelParser();
            curveEntities = excelParser.ParseExcel("your_excel_file_path.xlsx");

            // 将解析后的数据传递给控件
            wcsDynamicsControl1.curveEntities = this.curveEntities;
        }
    }
}
请将your_excel_file_path.xlsx替换为你实际的Excel文件路径。这段代码在构造函数中使用ExcelParser类来解析Excel文件,并将解析后的数据传递给控件。确保你的项目中已经包含了ExcelParser类的定义,并且已经正确引用了EPPlus库。文章来源:https://uudwc.com/A/AAXww
3.Excel文件举例
要创建一个.xlsx文件,以便使用之前提供的ExcelParser类来解析数据,你可以使用Excel编辑器(如Microsoft Excel)来创建文件,并确保以下格式:文章来源地址https://uudwc.com/A/AAXww
- 创建一个包含以下列的Excel工作表:
- 列1: 曲线名称
- 列2: 曲线颜色(使用HTML颜色表示,例如"#FF0000"表示红色)
- 列3: 数据点坐标(以逗号分隔的坐标对,用分号分隔不同的数据点,例如"1.0,2.0;3.0,4.0;5.0,6.0")
- 列4: 是否可见(使用"true"或"false"表示)
- 列5: 曲线介绍
- 在工作表的行中填入数据。以下是一个示例:
| 曲线名称 | 曲线颜色 | 数据点坐标 | 是否可见 | 曲线介绍 |
|---|---|---|---|---|
| SPU1 | #FF0000 | 1.0,2.0;2.0,4.0;3.0,6.0 | true | 曲线1 |
| 监控2 | #0000FF | 1.0,3.0;2.0,5.0;3.0,7.0 | true | 曲线2 |
| 电力3 | #FFFF00 | 1.0,4.0;2.0,6.0;3.0,8.0 | true | 曲线3 |
